
What is an Upthrust in Trading?
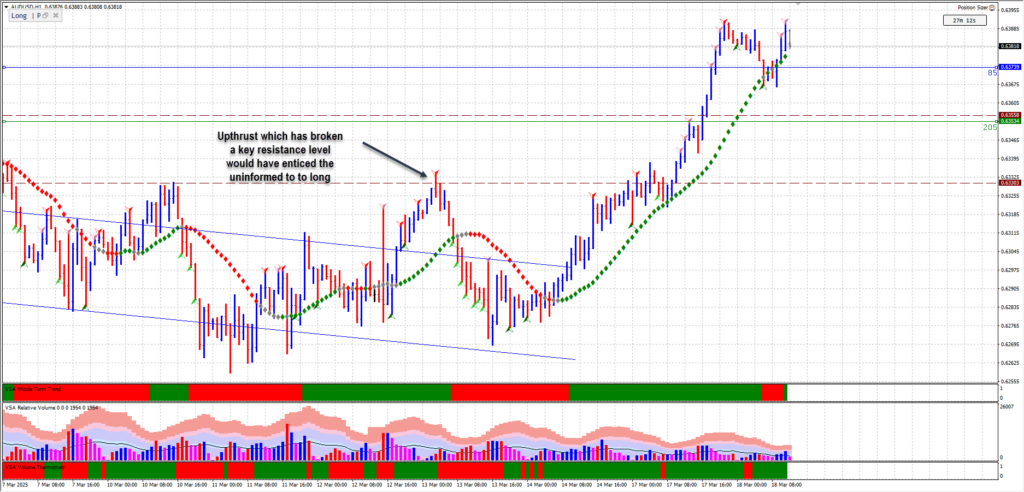
An upthrust is a deceptive market move designed to trap traders and has been observed in major market downturns. For instance, during the 2008 financial crisis, many stocks experienced sudden price spikes that quickly reversed, catching retail traders off guard. Similarly, in the dot-com bubble, several tech stocks showed upthrust patterns before their eventual decline, as professionals distributed shares at high prices before the market collapsed. and shift market control from retail investors to professionals. It appears as a price spike that quickly reverses, closing near its low with an average to wide price spread. Market makers often execute these moves to hit stop-loss orders of short traders and entice uninformed buyers into long positions before the price collapses.
Recognizing a Upthrust
A reversal bar exhibits the following characteristics:
- Marked-up price at open – Often driven by positive news.
- Sharp decline – The price quickly reverses after the initial push.
- Closes near its low – Showing a lack of buyer strength.
- Volume confirmation:
- High volume suggests selling by professional traders.
- Low volume signals a lack of professional interest in the upside.
- Visual resemblance to a telegraph pole – A key technical indicator for experienced traders.
Background Conditions for Market Weakness
A reversal pattern is more significant and reliable when it occurs in a weak market background. Look for these precursors:
- Prior high-volume up bars closing in the middle – Indicating potential selling pressure. For example, in 2008 before the financial crash, multiple stocks showed high-volume up bars failing to hold gains, signaling professional distribution.
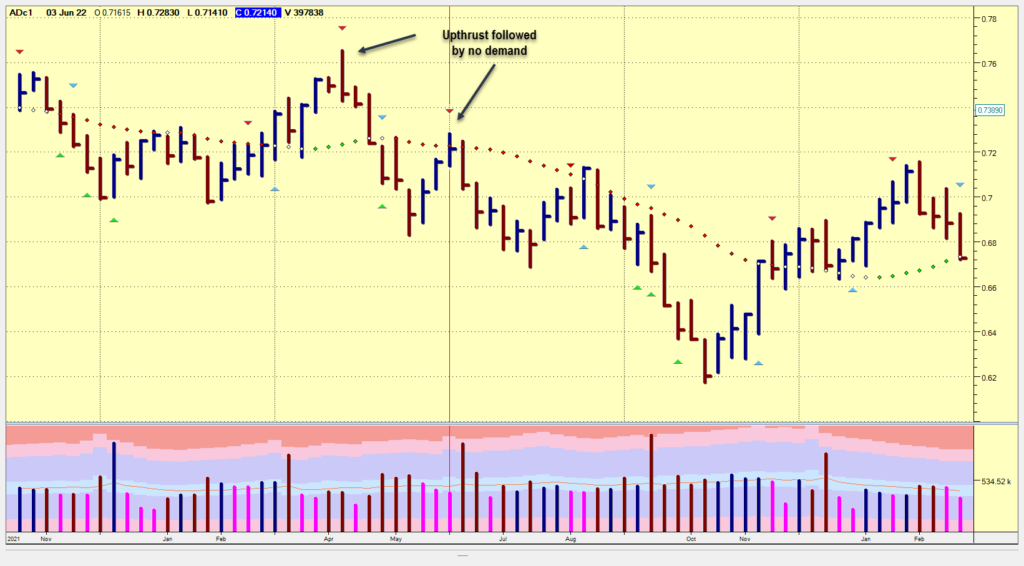
- No demand up bars – Showing a lack of bullish commitment. A similar situation was seen in the tech bubble of 2000, where many stocks attempted to push higher on low volume but failed to sustain their gains.
- Absence of strong support – Making it easier for price to decline. A good case study is the 2015 Chinese stock market crash, where weak support levels led to sharp declines after initial upthrusts.
If strength is evident in the background, the reversal might be a false signal and could be tested before the market moves higher.
A reversal pattern is more significant and reliable when it occurs in a weak market background. Look for these precursors:
- Prior high-volume up bars closing in the middle – Indicating potential selling pressure.
- No demand up bars – Showing a lack of bullish commitment.
- Absence of strong support – Making it easier for price to decline.
If strength is evident in the background, the reversal might be a false signal and could be tested before the market moves higher.
What to Expect After an Upthrust?
A true reversal often leads to lower prices. Watch for:
- Further signs of weakness (SOW), such as no demand bars, confirming the market’s bearish sentiment. This can include price struggling to rise despite low-volume up bars, or increasing selling pressure visible through high-volume down bars.
- Potential tests – Be cautious as the market might attempt a test of the reversal level.
- Volume and spread analysis:
- A down bar with a narrow spread and low volume after a reversal signals weak selling pressure, suggesting hesitation in the downtrend.
- High-volume down bars closing off the lows with a subsequent up bar indicate potential strength, requiring a retest before confirming direction.
An upthrust often leads to lower prices. Watch for:
- Further signs of weakness (SOW), such as no demand bars, confirming the market’s bearish sentiment.
- Potential tests – Be cautious as the market might attempt a test of the reversal level.
- Volume and spread analysis:
- A down bar with a narrow spread and low volume after a reversal signals weak selling pressure.
- High-volume down bars closing off the lows with a subsequent up bar indicate potential strength, requiring a retest before confirming direction.
How Traders Can Use Market Reversals to Their Advantage
- Confirm Weakness: Always assess background conditions before acting.
- Use Stop Losses Wisely: Place stops strategically to avoid market traps.
- Watch for Tests: If the market retests the reversal zone with no strength, it reinforces bearish momentum.
- Look for Additional SOW: More signs of weakness solidify bearish conviction.
Conclusion
A upthrust is a powerful bearish signal that smart traders can leverage to anticipate market downturns. To apply this knowledge, traders should analyze historical charts and identify upthrust patterns in different market conditions, refining their ability to spot professional activity and avoid common retail traps. Understanding its characteristics, background conditions, and follow-through behavior can help traders avoid traps and position themselves effectively.
Leave a Reply