Introduction: The Hidden Risk Behind Market Euphoria
When markets are rising fast and optimism is everywhere, most traders feel safe. However, this is often when risk is at its highest. The Potential Buying Climax is a pattern. It marks the exact moment when the market’s balance of power shifts. This shift occurs subtly from demand (buyers) to supply (sellers).
This shift typically occurs after a strong uptrend. At this point, institutional players or smart money start distributing their positions to euphoric retail traders. The price may still climb, but strength is turning into weakness under the surface. Understanding this turning point is essential for traders who want to anticipate, not react to market reversals.
This article dives deep into the Wyckoff Method. It explores the psychology of market participants and technical confirmations of this pattern. These insights provide you with the tools needed to spot professional selling before the market declines.
The Wyckoff Method: The Foundation for Understanding Market Behavior
Developed by Richard D. Wyckoff, this method breaks down market structure into predictable cycles of accumulation, markup, distribution, and markdown. One of the most insightful elements of Wyckoff’s work is the idea of the Composite Man. This is an imaginary figure. He represents all the large institutional players in the market.
Wyckoff’s teachings remain relevant over a century later because they are rooted in human psychology and market logic:
The Three Laws of Wyckoff:
- The Law of Supply and Demand – When demand exceeds supply, prices rise. When supply exceeds demand, prices fall.
- The Law of Cause and Effect – Accumulation or distribution is the cause. The subsequent price movement is the effect.
- The Law of Effort vs. Result – A comparison between volume (effort) and price movement (result) reveals true market intention.
These laws guide traders in identifying the motives behind price moves. A Potential Buying Climax violates the law of Effort vs. Result—despite large volume, the price fails to move significantly higher.
Anatomy of the Potential Buying Climax Bar
A potential buying climax appears as a high or ultra-high volume up bar. It closes in the middle or lower part of its range. This suggests that professional selling occurred on what looked like a strong rally. Even though the price pushed higher, the inability to close at or near the high exposes underlying weakness.
Visual Characteristics:
- Widest spread bar in recent days or weeks
- Significant increase in volume compared to the average
- Fails to close strongly (middle or bottom third of the bar)
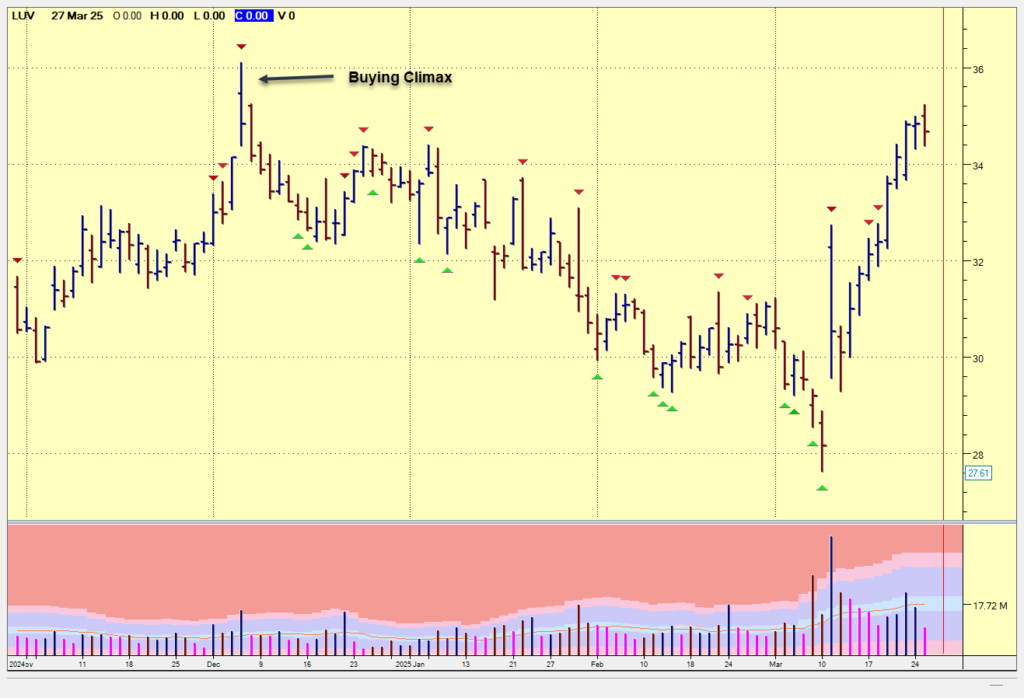
This bar must be viewed within the context of an existing uptrend. If the market has not made new highs recently, the signal is less powerful. Often, this bar coincides with a news release or earnings announcement, used by institutions to attract volume for distribution.
Psychological Dynamics: Herd Behavior and FOMO
Retail traders tend to respond emotionally. When prices are high and media coverage is positive, they buy out of fear of missing out (FOMO). Institutions understand this behavior and time their distribution to exploit it.
- Public reaction: Enthusiastic buying
- Professional action: Quietly selling into strength
- Outcome: Price fails to advance and reverses soon after
This creates a divergence between what traders believe is happening and what is actually happening.
Volume Spread Analysis (VSA) and the Potential Buying Climax
VSA is the tool that bridges price action with volume interpretation. When applied to a buying climax:
- A wide spread up bar on ultra-high volume suggests massive activity.
- If the result (closing price) does not reflect the effort (volume), the bar is deceptive.
This discrepancy often indicates professional selling. The market is absorbing retail demand—not continuing the uptrend.
How VSA Interprets a Potential Buying Climax:
- Volume is exceptionally high (effort)
- Price fails to close at the high (weak result)
- Price may reverse in subsequent sessions
VSA doesn’t rely on indicators—it reads the tape directly.
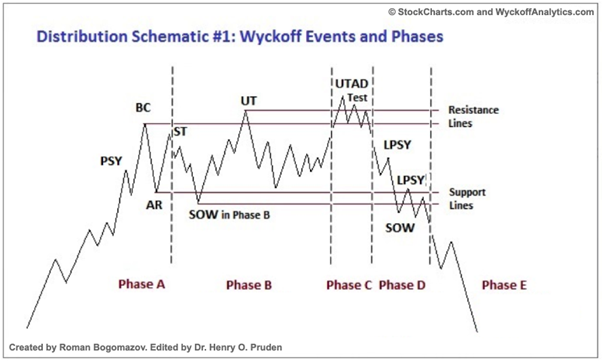
Structural Role in Wyckoff Distribution
The potential buying climax is not a standalone event. It plays a vital role within Wyckoff’s distribution phase:
Phases of Distribution:
- Phase A: Preliminary supply and buying climax appear
- Phase B: Sideways volatility increases, upthrusts begin
- Phase C: Traps are laid (e.g., upthrust after distribution)
- Phase D: Breakdown begins with signs of weakness (SOW)
- Phase E: Full markdown and panic selling
The Potential Buying Climax is most often part of Phase A or C. It depends on whether it’s the first sign of weakness. Alternatively, it could be a final trap before the markdown.
Confirmation: What Follows the Potential Buying Climax?
One bar is not enough. Confirmation increases probability. After a potential buying climax, traders should look for:
- SOW (Sign of Weakness): A sharp down bar on high volume
- No Demand bar: A narrow up bar on low volume
- Lower highs and lower closes
- Failed rallies: Attempts to rise are met with selling
Without these confirmations, the bar might be just profit-taking.
Entry Strategy and Risk Management
Step-by-step plan:
- Identify the climax bar within a strong uptrend
- Wait for confirmation: Down bar, no demand, or SOW
- Short on a failed rally (LPSY)
- Set stop-loss just above the climax bar high
- Take profit at prior support or with volume clues
Position sizing and patience are key. Entering too early can lead to whipsaw.
Mistakes Traders Make With Potential Buying Climax
- Buying breakouts on the climax bar
- Ignoring volume behavior
- Acting on one bar without context
- Failing to confirm with price structure
Discipline and education prevent these costly errors.
Real-World Example: S&P 500 (2021–2022)
In late 2021, the S&P 500 showed a buying climax:
- New highs with ultra-high volume
- Weak closes in up bars
- Media coverage was euphoric
Shortly after, the market entered a long correction phase. Distribution was underway.
Tools and Platforms
- TradingView or MT4 or MT5: For bar-by-bar analysis
- Volume profile tools: To spot high-volume nodes
- Wyckoff schematics: For phase identification
- Point and Figure charts: To measure cause/effect
Final Thoughts: Listen to the Market, Not the Crowd
The Potential Buying Climax is an early clue that the market may be reversing. It’s not a guarantee, but it is a major warning sign—especially when paired with other Wyckoff concepts.
By studying volume, structure, and sentiment, you gain a deep edge. You start to think like the Composite Man—and that’s where profitable trading begins.
FAQs
- How often do buying climaxes occur?
- They appear regularly in liquid markets, especially near highs.
- Can it be used in intraday trading?
- Yes, especially on 5–30 minute charts during news spikes.
- Do they apply to crypto or forex?
- Yes. The principle of supply/demand and smart money behavior applies to all liquid markets.
- What makes the climax bar reliable?
- High volume, wide spread, weak close, and confirmation in following bars.
- Can you automate the detection?
- Some platforms offer scripts for VSA and Wyckoff events, but manual context is still essential.
Leave a Reply