
The NZD/USD Wyckoff & VSA Analysis reveals notable price action, leading traders to question whether the market is gearing up for an upward breakout or preparing for another leg down. Understanding these movements through Wyckoff methodology and Volume Spread Analysis (VSA) allows traders to determine if smart money is accumulating or distributing their positions.
This detailed analysis will cover three crucial observations:
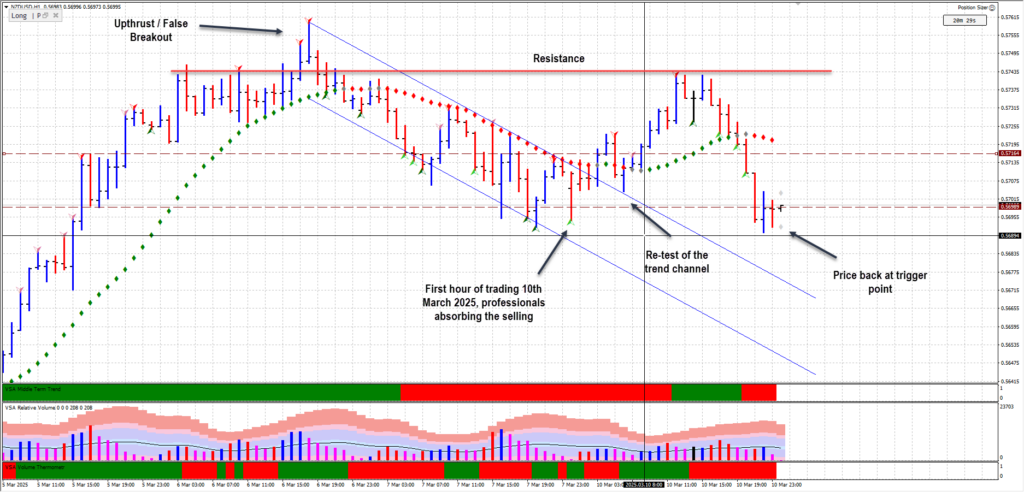
- The first hour of trading showed initial weakness, but the price recovered, closing near the highs, indicating potential strength.
- A breakout above the upper trend channel followed by a retest suggested No Demand before moving towards a key resistance zone.
- A sharp two-hour decline occurred before a test and weak rally on average volume, followed by another aggressive drop back to the lower trigger point.
By combining these price actions with daily market behavior, we will assess whether this level is being tested for a stronger move higher or if bearish momentum will prevail.
First Hour of Trading: Weakness Followed by Strength
The first hour of trading is critical in forex markets as it often reflects the activity of institutional players and sets the tone for the rest of the session. During this period, NZD/USD showed signs of initial weakness, with the price dropping to a lower trigger point. However, despite the decline, the price recovered and closed near the highs of the session.
Wyckoff Interpretation
According to the NZD/USD Wyckoff & VSA Analysis, price closing near the highs after an initial drop suggests that supply is being absorbed rather than distributed. If smart money were aggressively selling, we would expect the price to close near the lows, confirming weakness. The ability of the price to recover hints at underlying strength, but it requires further confirmation through volume behavior.
VSA Perspective
From a Volume Spread Analysis (VSA) standpoint, the significance of this movement depends on the volume:
- High volume with a bullish close indicates professional buying (accumulation), reinforcing insights from NZD/USD Wyckoff & VSA Analysis.
- Low volume on the rally suggests a temporary lack of selling pressure rather than strong buying interest.
Traders must monitor subsequent price action and volume for confirmation, as outlined in the NZD/USD Wyckoff & VSA Analysis, to determine if the market is preparing for an upward continuation or another wave of selling.or confirmation before making a decisive move.
NZD/USD Wyckoff & VSA Analysis: No Demand Signal?
After the initial strength, the price broke above the upper trend channel and subsequently retested it before continuing towards a previous resistance level. However, despite the breakout, the price movement lacked conviction.
Wyckoff Interpretation
In Wyckoff analysis, a trend channel breakout is usually a bullish signal, but it requires strong demand to sustain higher prices. A failure to push significantly higher after a breakout could indicate that smart money is using the upward move to offload positions, leading to potential distribution rather than accumulation.
VSA Perspective
A key concept in Volume Spread Analysis is the No Demand bar, which appears when the price rises but fails to attract significant volume. If the breakout and retest occurred on declining volume, it suggests that buying pressure is weak and that smart money is not actively supporting the higher prices. This could be a warning sign of an impending downturn.
Two-Hour Decline, Retest, and Weak Rally Before a Sharp Drop
Following the breakout and retest, the price underwent a significant two-hour decline, dropping towards the support zone. After a brief test, the price attempted to rally towards resistance but did so on average volume before experiencing another sharp decline back to the lower trigger point. This movement aligns with the NZD/USD Wyckoff & VSA Analysis, which helps traders assess whether the decline is part of a larger distribution phase or a shakeout before accumulation.
Wyckoff Interpretation
A strong decline followed by a weak rally on average volume suggests that supply is still dominant in the market.
The test before the rally was likely an attempt by smart money to gauge the remaining selling pressure.
The subsequent sharp drop confirms continued weakness, indicating a lack of demand from buyers.
VSA Perspective
From a Volume Spread Analysis (VSA) standpoint:
- A strong rally would have required higher volume and wider spreads, confirming genuine buying interest.
- Since the rally occurred on average volume, it implies that buyers were not stepping in aggressively.
- The steep drop that followed suggests that the market lacked strong hands to sustain upward momentum, further strengthening the bearish case in NZD/USD Wyckoff & VSA Analysis.
NZD/USD Wyckoff & VSA Analysis: Is the Lower Trigger Point Being Tested for a Larger Move?
With the price lingering around the lower trigger point, similar to March 7th, an important question arises: Is this level being tested before a significant move?
Wyckoff Interpretation
If the market is testing this level with decreasing volume and narrow spreads, it may indicate accumulation before a bullish breakout. However, if price continues testing this level on high volume and weak recoveries, a breakdown may be imminent.
VSA Perspective
- High volume with bullish closes at this level signals demand stepping in.
- Weak rallies or increased volume on down moves suggest continued supply dominance.
Future Outlook: Mark-Up or Another Shakeout?
Based on NZD/USD Wyckoff & VSA Analysis, traders should watch for:
- Strong buying at the trigger point, which could indicate an upward move.
- A weak rally followed by a breakdown, signaling further downside potential.
Bullish Scenario: If price holds and volume increases, expect a move higher.
Bearish Scenario: If the price lingers without demand, the market could move lower.
The recent NZD/USD Wyckoff & VSA Analysis provides mixed signals. While the first-hour movement suggested strength, the subsequent No Demand rally and sharp decline hint at distribution. The price currently remains near the lower trigger point, resembling the behavior on March 7th. Traders should closely monitor volume and price reactions at this level to determine the next major move.
FAQs
What is the Wyckoff methodology?
Wyckoff’s methodology analyzes market behavior based on accumulation, distribution, and price cycles.
What is No Demand in VSA?
A No Demand bar appears when the price rises on low volume, signaling weak buying interest.
How does volume confirm price action?
High volume on up moves suggests strength, while low volume rallies indicate weak demand.
What does a test mean in Wyckoff analysis?
A test is a small price movement designed to confirm whether supply or demand is present.
Should I buy or sell NZD/USD now?
The decision depends on how the price reacts to the lower trigger point. Monitoring volume and spreads will provide clarity.
Leave a Reply