
AUDUSD Forecast Today: Technical Trade Analysis Near Resistance at 0.64000
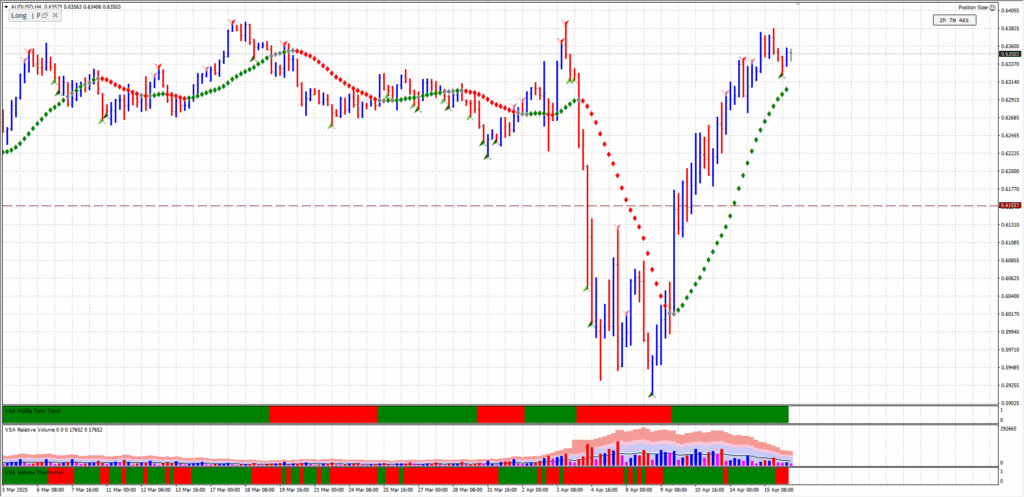
In the AUDUSD forecast today, we discuss how I placed a winning trade. This was done using principles from Volume Spread Analysis (VSA) and Wyckoff methodology. The market rallied to a significant resistance level of around 0.64000. This was a key psychological barrier. This occurred just before a major geopolitical news event: the announcement of tariffs by President Donald Trump.
As expected, the market reacted sharply. The price dropped aggressively. This exhibited what we often see as a smart money shakeout. It was a rapid markdown designed to remove weak hands and trap retail traders. What followed was classic smart money behaviour in the AUD/USD pair.
VSA Insight Into Professional Buying After the Drop
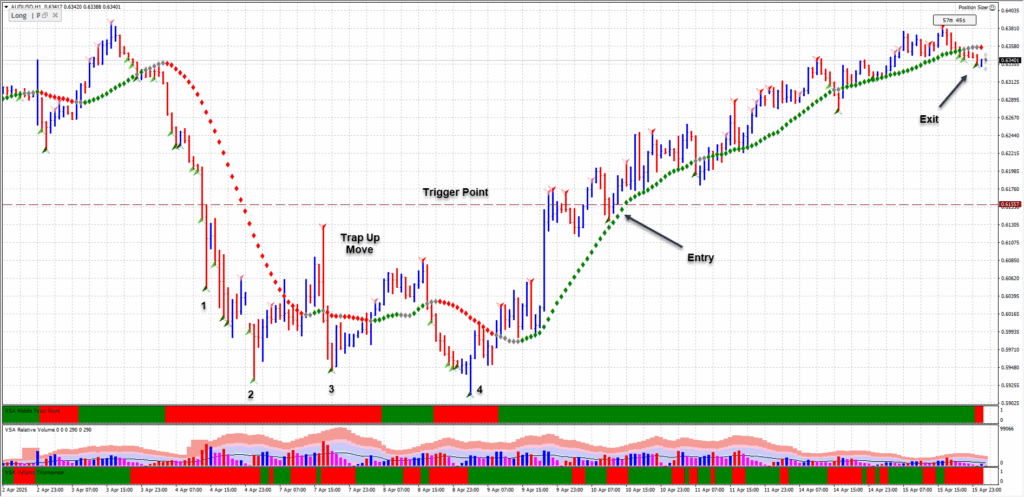
On the 1-hour chart, signs of potential professional buying at point 1 began to emerge. A wide spread down-bar with a strong close off the lows indicated the absorption of selling pressure. This is a foundational VSA concept.
This bar would become our reference point. The high of this professional buying bar, 0.61557, was established as a future trigger level. Smart money activity tends to revisit these zones. These zones often act as magnets for future price action in today’s AUD/USD forecast.
AUDUSD Forecast Today: Smart Money Testing the Lows in Trade Consolidation
During the sideways consolidation that followed, the market began to test the lows repeatedly — another hallmark of accumulation. At what we’ll label Point 2, a key VSA signal showed up: Strength in a down bar. The price dipped, luring in shorts, only to close on the highs.
Retail traders were caught off guard, shorting what looked like a continuation, while the professionals were quietly accumulating positions. The market rally created the trap up-move as price rallied sharply back to the 0.61557 trigger, drawing in more buyers before the next markdown in AUDUSD forecast today.
Trap Up Move and Wyckoff Confirmation of Manipulation
Once the price reached the previous trigger level, it quickly reversed. This is classic Wyckoff-style upthrust behaviour — a trap up-move designed to mislead market participants. Price revisited the lows once again. It broke below support at Point 2. Notably, it closed back on the highs.
This was not weakness — this was the absence of supply. No aggressive selling, just a test to see if any sellers remained. The professionals were still accumulating. Their footprints were visible in every test of the lows in this AUDUSD forecast today.
Trigger Point Reaction and Strength at Point 4
The market finally rallied back to our 0.61557 trigger point, labelled now as Point 4. Price moved sideways again, and a VSA strength bar printed at the trigger. This was the green light. Volume confirmed the move — the smart money had positioned itself in the AUD/USD pair.
Price rallied once more toward the 0.64000 resistance, our original key level. Knowing this was a historically strong supply zone, I adjusted my stop loss to just below the latest trough. Eventually, I was stopped out. However, not before I caught a highly structured, low-risk, smart-money-aligned move in this AUD/USD forecast today.
Conclusion: A Winning AUDUSD Forecast Today Using VSA + Wyckoff
This trade was a strong example of how the VSA and Wyckoff methodologies help traders think beyond price and volume. We gain an edge in our AUDUSD forecast today by interpreting what the professionals are doing. This approach focuses on more than just where the price is going. Recognising traps can lead to consistent wins. Understanding test bars also plays a crucial role. Waiting for confirmation at key levels is essential as well, differentiating between consistent wins and random trades.
FAQs
1. What is VSA in forex trading?
VSA (Volume Spread Analysis) is a methodology that interprets the relationship between price movement, volume, and the closing price. It aims to identify the activity of professional traders, also known as smart money, in forex markets like AUD/USD.
2. How does Wyckoff theory relate to VSA?
Both focus on understanding smart money behaviour. Wyckoff emphasises accumulation and distribution phases. It also highlights market cycles. VSA focuses on individual bars and volume patterns. Both are useful in AUD/USD trade analysis.
3. Why is 0.64000 a key resistance in AUD/USD?
It’s a psychological level and a historical supply zone where price has previously reversed. These areas often attract institutional activity in AUD/USD.
4. What is a trap up-move in forex trading?
A price movement designed to lure in breakout buyers, only to reverse and trap them in losing positions. It’s a classic smart money strategy observed in AUD/USD trade analysis.
5. Can I use VSA and Wyckoff together in AUD/USD trading?
Yes. Combining both provides a more complete picture of market manipulation and intent. This makes it a powerful strategy for price action traders focused on the AUD/USD pair.
Leave a Reply