
The recent volatility on the ASX200 on March 11, 2025, presented traders with a textbook Wyckoff accumulation scenario. Climactic action, triggered by negative news from major financial sources such as ABC and News.com.au, painted a dire outlook. However, astute traders employing the Wyckoff method saw an excellent opportunity to align their trades with professional money.
What Triggered the Climactic Action on ASX200?
On March 11, 2025, at 17:00 UTC, the AUS200 experienced extreme volatility driven by President Trump’s aggressive tariff threats, sparking recession fears globally. This negative sentiment resulted in significant declines, especially within the technology sector. High-volume trading accompanied these sharp drops, indicating potential climactic selling—a crucial Wyckoffian indicator of possible accumulation by informed market players.
Wyckoff Method of Analysis of the AUS200 1-Hour Chart
Identifying Climactic Action
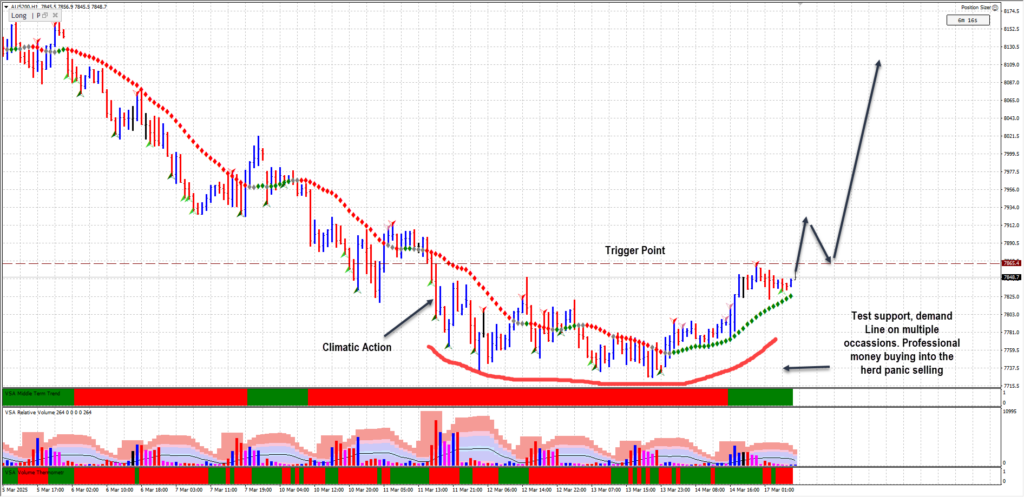
The AUS200 index showed an ultra-high volume bar at 17:00 UTC, indicative of climactic selling. This intense selling often marks the beginning of an accumulation phase, a cornerstone of Wyckoff’s analysis.
Confirmation of Professional Buying
The subsequent hourly bar closed higher, immediately confirming buying pressure. Wyckoff traders set the key trigger point at the high of the climactic bar, precisely 7865.4. This crucial level acts as the pivot for future trade setups.
Smart Money’s Intentions
After the initial bounce, smart money professionals encouraged retail traders to continue selling, pushing the market lower. Prices tested support around 7737 multiple times with three distinct tests. Each test showed diminishing selling pressure, demonstrating that professional investors were absorbing the available supply.
Marking Price Back Up
Having absorbed significant volume at the lows, professionals gradually marked the price back up to our predefined trigger at 7865.4. A break above this level, followed by a re-test and subsequent bullish action, would confirm the Wyckoffian accumulation and present a high-probability trading setup.
Analysis of Higher Timeframes
4-Hour Chart
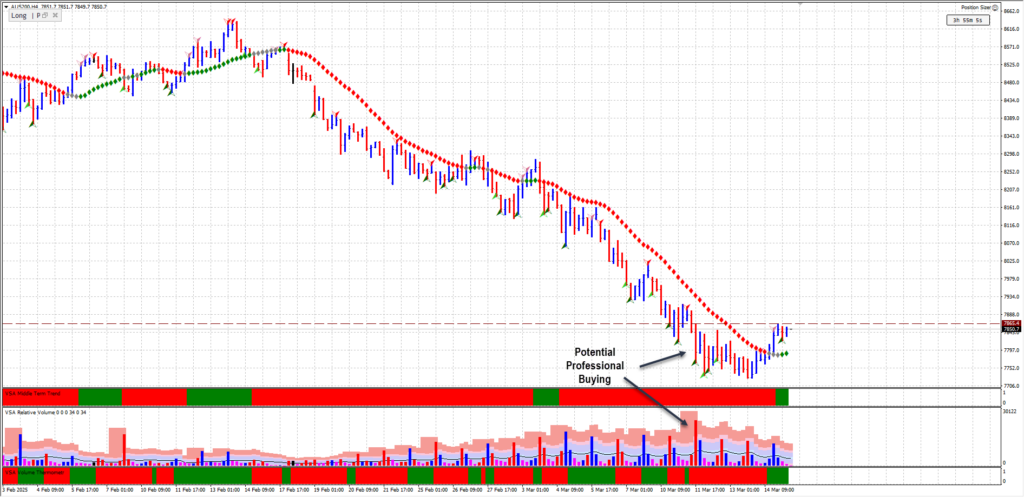
The 4-hour chart complements the hourly chart analysis by clearly indicating potential professional buying. This timeframe shows multiple attempts by professional investors to absorb supply at lower prices, evidenced by repeated tests of support accompanied by diminished selling volume. Each test reinforces the likelihood that smart money has entered the market to accumulate positions.
Daily Chart
On the daily chart, the pattern clearly shows demand beginning to overcome supply. After the climactic sell-off, each subsequent trading day exhibits gradually decreasing volatility and stabilizing price action. These are typical signs that the buying strength of professional investors is successfully absorbing and exhausting selling pressures, paving the way for a bullish reversal.
Wyckoff Method Trading Setup and Strategy
- Trigger Level: 7865.4
- Confirmation: Break above trigger, retest, and subsequent bullish bar
- Support Level: 7737 tested successfully three times
Wyckoff traders will enter a long position only upon confirmation, aligning themselves with the professional money flows.
Conclusion
The AUS200’s recent climactic action provided Wyckoff traders with a clear accumulation scenario. By accurately identifying smart money activities amidst widespread negative sentiment, traders can capitalize on significant market reversals.
Using the Wyckoff method to interpret volume and price action allows traders to confidently enter the market with the professionals, significantly improving their trading outcomes.
Leave a Reply