
Introduction
I am currently in a short trade on USD/CHF, and I want to analyze the retracement phase on the right-hand side of the chart to determine the future direction of the price movement. Using a combination of Wyckoff’s methodology and Volume Spread Analysis (VSA), we can gain deeper insights into whether this retracement signals a true reversal or a continuation of the downtrend.
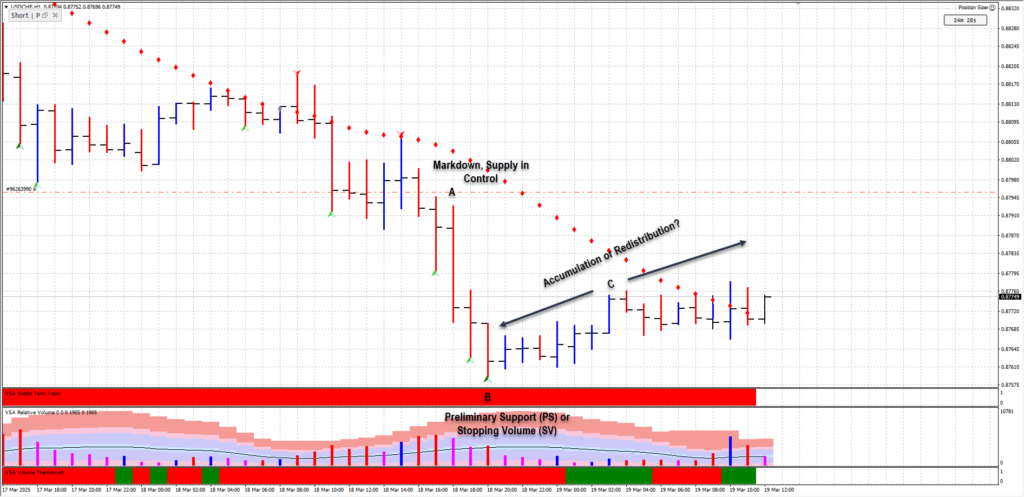
Step-by-Step Wyckoff & VSA Analysis
1. Prior Downtrend – Markdown Phase A
Looking at the left-hand side of the chart, we see a strong markdown phase:
- Consecutive lower lows and lower highs confirm a clear bearish trend.
- The wide-spread red bars indicate that supply is dominant.
- Volume spiked on bearish bars, reinforcing that sellers were in control.
- The red diamond indicators above the price action further confirm that the trend was clearly bearish.
2. Signs of Support Emerging Phase B
After the sharp downtrend, the price reaches a potential support level, where several key signs emerge:
- Green arrows appear, suggesting that demand may be stepping in.
- A horizontal consolidation phase forms as price begins to trade sideways.
- Some blue bars appear within the range, indicating that buyers are attempting to absorb supply.
- However, there is no strong breakout yet, meaning the market is at a decision point.
3. Retracement Phase (Current Price Action) Phase C
The right-hand side of the chart shows a retracement after the markdown. Let’s break this down:
- The retracement bars are small and overlapping, which is a sign of weak demand.
- Volume is decreasing, meaning buyers are not aggressively stepping in.
- A few blue (bullish) bars appear, but they lack wide spreads and high volume, suggesting inefficiency in demand.
- This could indicate a weak pullback before another leg down.
What’s Next? Future Direction Based on Wyckoff & VSA
🔹 Scenario 1: Breakout & Reversal (Bullish Case)
If demand suddenly increases, we would expect:
- A strong bullish bar with high volume to act as a Sign of Strength (SOS).
- A higher low formation, which would indicate buyers are absorbing supply.
- A potential breakout above the range, leading to a new markup phase.
🔻 Scenario 2: Weak Rally & Continuation Down (Bearish Case – More Likely)
If this retracement is simply a weak rally, then we should look for:
- An Upthrust After Distribution (UTAD), where price fakes an upward breakout but gets rejected.
- A sudden increase in selling pressure (large red bars on high volume).
- A breakdown below the current sideways range, confirming another markdown phase.
Final Thoughts & Trade Implications
Given the current market conditions, this retracement does not yet show strong bullish characteristics. The low volume and lack of convincing demand suggest this could be a trap before another leg lower.
- If buyers fail to step in, this could confirm a redistribution phase, meaning the downtrend will likely continue.
- I will be closely monitoring volume and spread behavior to determine if a true reversal is forming or if I should hold my short position for further downside.
Conclusion
Using Wyckoff and VSA, the current retracement appears weak, making a bearish continuation more likely unless demand shows strong confirmation. This trade requires close observation of price action, volume, and breakout behavior before making further decisions.
Leave a Reply