
The stock market is a battleground between supply and demand, where smart money leaves clues through price action and volume. One of the most effective methodologies for uncovering these clues is Wyckoff Volume Spread Analysis (VSA). By examining SOLV stock using this approach, we can identify critical trigger points, supply zones, and potential price movements that could determine the stock’s next big move.
Since its launch in April 2024, SOLV has exhibited textbook Wyckoff VSA patterns, offering valuable insights into the behavior of institutional players. In this article, we will dissect SOLV’s price action and volume characteristics, highlighting key levels, confirming signs of strength and weakness, and evaluating whether the stock is poised for a breakout or a continued decline.
Understanding Wyckoff VSA and Its Importance
Before diving into SOLV’s price action, it’s crucial to understand the Wyckoff VSA methodology. Developed by Richard Wyckoff, this technique revolves around three main principles:
- Effort vs. Result – A large volume increase should lead to a proportionate price move. If not, it signals supply absorption or hidden selling.
- Cause and Effect – Accumulation (buying) and distribution (selling) phases create the groundwork for future price trends.
- Supply and Demand – Prices rise when demand outweighs supply and fall when supply dominates.
By analyzing price spread and volume relationships, traders can detect smart money accumulation, distribution, and trap moves before the market makes its next big shift.
SOLV Stock: Launch and Early Market Behavior
SOLV stock debuted in April 2024, opening with a widespread down bar on very light volume. This type of price action typically signals a lack of aggressive selling rather than outright weakness. However, things took a dramatic turn in the second week, where an up bar closed near the previous week’s range with ultra-high volume.
Such an event is critical in Wyckoff VSA because ultra-high volume bars usually indicate professional involvement. However, the nature of this involvement—whether it’s buying (absorption) or selling (distribution)—is only confirmed by future price action.
Given the high volume, we established trigger points at the high and low of this bar to track SOLV’s future movements. These levels acted as key decision points, helping us interpret whether the stock was showing signs of strength or weakness.
Week 3 Reversal: Confirming Hidden Selling
The third week saw a complete reversal of the previous week’s price action. According to Wyckoff principles, this strongly suggests that the ultra-high volume from the previous week was selling in the background rather than genuine demand. The stock continued to rally for a few weeks, but subtle weakness emerged towards the end of the uptrend.
The major warning sign came when SOLV printed an upthrust bar near $62.00, only to quickly reverse and drop below the trigger point. An upthrust bar is a classic Wyckoff distribution signal, where institutions push prices higher to trap breakout traders before unloading their positions.
Major Price Swings and Reaccumulation Attempts
Following the breakdown below $62.00, SOLV stock fell sharply to $49.00, where we saw a significant change in behavior. A bullish engulfing candle emerged at this level, signaling potential demand returning to the market. This led to a strong rally, with the price surging back up to the top trigger point at $72.44.
From there, SOLV entered a consolidation phase between $65 and $75, forming a trading range. Consolidations like these often represent either reaccumulation (if demand is present) or redistribution (if supply dominates). The deciding factor is always the volume signature at key breakout points.
January 17th Breakout Attempt and VSA Supply Signals
On January 17th, another bullish engulfing candle broke through the $72.44 trigger point. This breakout initially appeared promising, but Wyckoff traders always look deeper into the volume context.
A few days later, SOLV printed a wide-spread up bar with ultra-high volume, closing in the middle of the range. According to Wyckoff VSA, this is a classic supply coming in signal—an indication that sellers are present despite the price moving higher.
This warning was quickly validated when the next week’s bar turned into a down bar, confirming the weakness and suggesting the smart money was offloading positions rather than absorbing supply.
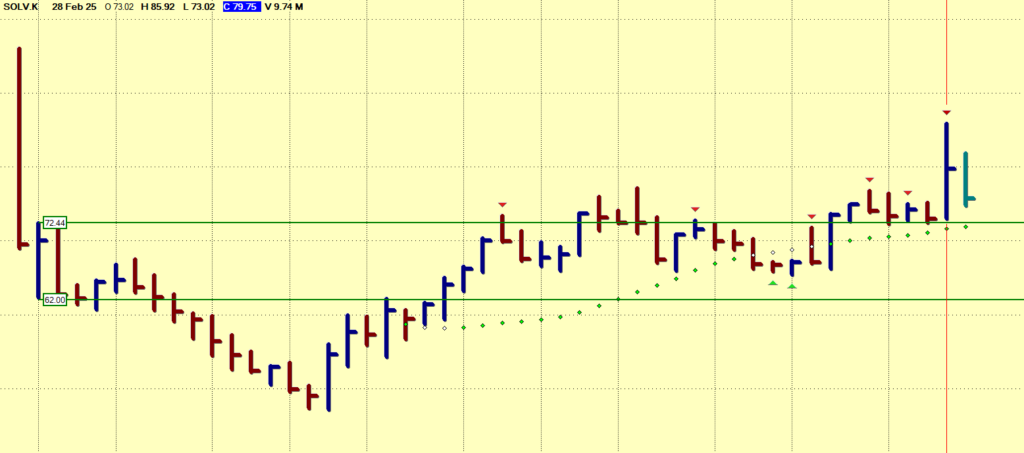
Current Market Position: What’s Next for SOLV?
As of now, SOLV is once again approaching the $72.44 trigger point, raising the question:
- Will the stock break lower and continue its downtrend?
- Or will it test resistance, absorb supply, and push towards $80?
The answer lies in how price interacts with the trigger point. For a bullish scenario, we need to see a low-volume test at $72.44, confirming a lack of selling pressure. Additionally, price must surpass the recent supply bar before considering long entries.
On the other hand, if price struggles at $72.44 and fails to attract significant demand, it may signal further downside, with a potential drop back towards $65 or even $49 if selling accelerates.
Key Takeaways & Trading Strategy
- Ultra-high volume on up bars requires confirmation – The second week’s volume surge initially seemed bullish, but the reversal in week three exposed it as a distribution event.
- Trigger points ($72.44 and $62.00) have been critical decision levels – These acted as key markers for price action shifts.
- The current price action suggests an inflection point – Traders should watch for a low-volume test at $72.44 or a strong demand surge before taking long positions.
- Failure to reclaim supply levels could result in further downside – A rejection at $72.44 could bring SOLV back to $65 or lower.
Conclusion: Watching for the Next Big Move
SOLV stock has followed a textbook Wyckoff VSA pattern, offering clear insights into the balance of supply and demand. With the stock once again nearing its key trigger point at $72.44, traders must stay vigilant for signs of strength or weakness before making a move.
If the price successfully holds above this level with a lack of supply, it may confirm reaccumulation and a move toward $80 or higher. However, if supply dominates once again, we may see a rejection and a push back toward lower levels.
For now, traders should let the market reveal its intentions, staying patient and waiting for clear signals before taking action. The next few trading sessions will be critical in determining SOLV’s fate.
FAQs
1. What is Wyckoff VSA and why is it useful for SOLV stock analysis?
Wyckoff Volume Spread Analysis (VSA) helps traders interpret smart money activity by analyzing volume and price spread. It reveals whether large institutions are accumulating or distributing stock, making it essential for analyzing SOLV’s price action.
2. What does an ultra-high volume bar indicate in Wyckoff VSA?
Ultra-high volume bars can indicate either strong buying (accumulation) or hidden selling (distribution). The context of the next few bars confirms whether demand or supply is dominant.
3. What does a failed breakout mean in Wyckoff methodology?
A failed breakout, like the one seen in SOLV after breaking $72.44, often signals a bull trap where smart money distributes stock to uninformed traders.
4. What is a low-volume test, and why is it important?
A low-volume test at resistance confirms the absence of supply, increasing the likelihood of a successful breakout.
5. Where is SOLV likely to go next?
The price action around $72.44 will determine SOLV’s next move. A strong close above this level could target $80, while failure to hold may lead to a drop towards $65 or lower.
Leave a Reply