
The Power of Wyckoff and VSA in Forex Trading
Mastering the Wyckoff and VSA Trading Strategy for AUD/USD is essential for traders who want to understand how smart money moves the market. The Wyckoff Methodology and Volume Spread Analysis (VSA) offer deep insights into market manipulation, accumulation, and distribution. These techniques help traders anticipate price movements rather than react emotionally.
This article breaks down a real AUDUSD 1-hour trade, showing how Wyckoff and VSA principles helped identify smart money accumulation, time an entry with precision, and achieve a high-probability trade setup.
Market Conditions Leading to the Trade
Before diving into technical analysis, it is crucial to understand the fundamental backdrop that influenced AUD/USD price movements.
On February 3, 2025, fears of a trade war emerged due to U.S. trade policy changes, negatively impacting the Asia-Pacific economy. Given Australia’s strong trade ties with China, this uncertainty weighed heavily on AUD/USD sentiment.
Adding to the bearish pressure, the Reserve Bank of Australia (RBA) cut interest rates by 25 basis points, bringing the cash rate to 4.1%. Concerns over U.S. tariffs and a slowing Chinese economy fueled further weakness in the Australian Dollar. As retail traders reacted to this negative news, AUD/USD declined, setting up the Wyckoff accumulation phase.
Identifying Smart Money Activity: Climactic Action on February 27, 2025
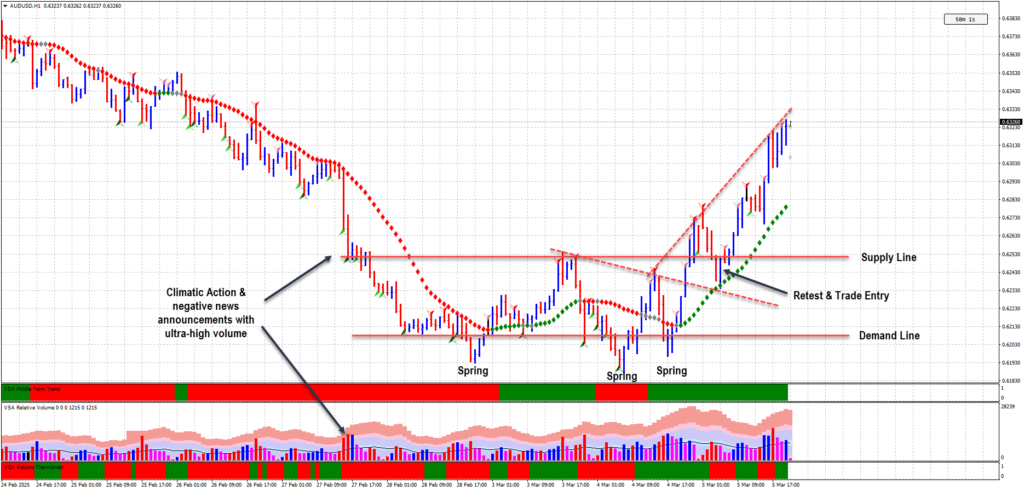
On February 27, 2025, at 15:00 and 16:00 UTC, the AUDUSD chart showed two consecutive ultra-high volume down bars. The VSA indicator signaled Potential Climatic Action, suggesting professional buying.
Retail traders, influenced by negative news, aggressively sold their positions. However, Wyckoff and VSA traders recognize that smart money does the opposite—accumulating positions when fear is at its highest.
The presence of high volume on down bars without follow-through suggested that supply was being absorbed. Instead of collapsing, the price stabilized and entered consolidation, confirming the beginning of a Wyckoff accumulation phase.
Wyckoff and VSA Trading Strategy: Accumulation Phase and Spring Formation
Following the climactic action, AUD/USD formed a tight trading range, aligning with the Wyckoff Accumulation Schematic. Institutional buyers were accumulating large positions before a breakout.
A key component of Wyckoff Accumulation is the spring—a false breakdown designed to trap sellers before a bullish reversal.
Three Key Spring Formations on AUD/USD
- February 28, 2025, at 20:00 UTC – The first false breakdown before the price recovered.
- March 4, 2025, at 06:00 UTC – Another shakeout, trapping weak hands.
- March 4, 2025, at 17:00 UTC – The final spring, confirming accumulation completion.
Each of these false breakouts occurred on high volume, reinforcing that smart money was absorbing supply. After the third spring, the price began its markup phase.
Trade Execution: Breakout and Retest of the Demand Line
Following the third Wyckoff spring, AUD/USD rallied and broke through resistance (supply line) at 0.62500.
Experienced Wyckoff and VSA traders do not chase breakouts. Instead, the best Wyckoff and VSA trading strategy involves waiting for a pullback to a key demand zone. After the breakout, the price retraced to retest the demand line, coinciding with positive Australian GDP figures. This retest provided an ideal low-risk, high-reward entry.
Trade Details and Risk Management
- Entry Price: 0.62508
- Stop Loss: 0.62235 (27.3 pips)
- Take Profit: 0.63115 (60.7 pips)
- Risk-to-Reward Ratio: 2.22:1
This setup adhered to Wyckoff and VSA trading strategy principles, allowing a calculated entry at the point of maximum opportunity with minimal risk.
Key Lessons from This Wyckoff and VSA Trade
- Smart Money Buys During Panic Selling – Retail traders sold due to negative news, while smart money was accumulating long positions.
- Volume Confirms Market Intentions – High volume on down bars with price stabilization signals accumulation.
- The Best Entries Happen on Retests, Not Breakouts – Waiting for a demand line retest increases trade success probability.
By following the Wyckoff and VSA trading strategy for AUD/USD, traders can anticipate market moves rather than react emotionally—an essential skill for long-term profitability.
Conclusion: Mastering Wyckoff and VSA Trading Strategy for Success
Trading with Wyckoff and VSA principles provides an edge in understanding smart money activity. This AUDUSD trade demonstrated a perfect Wyckoff accumulation phase, spring formations, and breakout-retest entry strategy.
By mastering market structure, volume behavior, and price action, traders can avoid market manipulation and align with institutional flow. The Wyckoff and VSA trading strategy for AUD/USD is a powerful approach for identifying accumulation zones and executing profitable trades.
FAQs
1. What is Wyckoff Accumulation, and how does it apply to forex trading?
Wyckoff Accumulation is when smart money accumulates positions before a bullish move. It includes false breakouts (springs) and a breakout confirmation, helping traders spot reversals before they occur.
2. How does VSA help confirm Wyckoff setups?
VSA analyzes price, volume, and spread to detect smart money activity. In Wyckoff setups, high volume on down moves without follow-through suggests accumulation, while springs with increased volume confirm the phase.
3. What is a Wyckoff Spring, and how do traders use it?
A Wyckoff Spring is a false breakdown below support, trapping sellers before price reverses higher. Traders use it as a low-risk entry point, especially when confirmed by VSA volume signals.
4. Why do breakouts often fail, and how can Wyckoff help?
Breakouts fail when smart money has not fully accumulated or distributed positions. Wyckoff’s method teaches traders to wait for a demand line retest, avoiding false breakouts.
5. How can I start using Wyckoff and VSA in forex trading?
Start by studying Wyckoff schematics, volume analysis, and market phases. Use live charts to practice identifying accumulation, distribution, springs, and breakouts, then combine these insights with VSA signals for confirmation.
Further Reading:
How to Identify a USDCHF Trend Reversal Using Wyckoff and Volume Spread Analysis
Leave a Reply