
After Donald Trump’s announcement on the U.S. Strategic Crypto Reserve, the prices of the crypto BTC, ETH, SOL, XRP, ADA and others soared. Let’s look at what happened on the 5-minute chart of Bitcoin.
1. Bitcoin’s Buying Climax: The Initial Surge
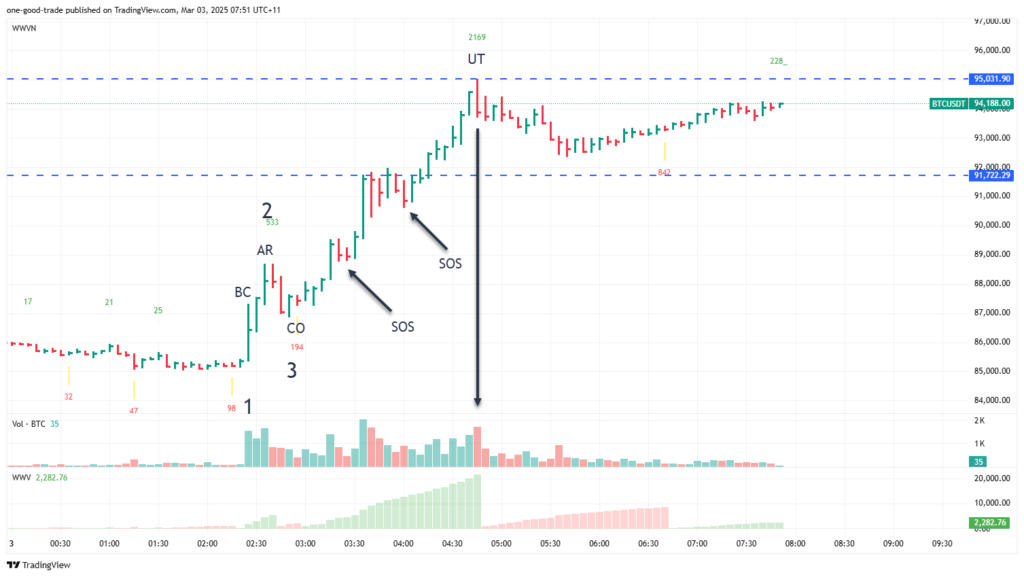
At Point 1, Bitcoin experienced a Buying Climax (BC) following Trump’s announcement, surging by $2,000. The ultra-high volume indicated strong public interest, but the widespread up-bar closed in the middle of its range, signaling the presence of preliminary supply (PSY).
The next bar closed higher but on slightly lower volume, which still remained significant—suggesting a possible Automatic Rally (AR). The third up-bar also closed in the middle of its range with higher volume, confirming that supply was being absorbed rather than exhausted.
2. Supply Absorption and Composite Operator Activity
Shortly after, at point 2, the price retraced for two consecutive bars, both closing at their lows but on significantly lower volume. This suggests weak supply, meaning sellers were not aggressively pushing the price down.
A small rally attempt followed but occurred on low volume, indicating a lack of strong demand. The next bar at point 3 printed a down move with even lower volume, reinforcing that selling pressure was drying up—a sign that the Composite Operator (CO) might be preparing for the next leg up.
3. Effort vs. Result: The Key to Predicting Higher Prices
The initial rally volume peaked at 533, whereas the retracement volume was only 194. According to Wyckoff’s Effort vs. Result principle, a stronger effort in the rally combined with a weaker retracement suggests higher prices ahead—exactly what unfolded.
Throughout the rally, down-bars occurred on low volume, while up-bars printed on increasing volume. This is a classic Sign of Strength (SOS), confirming the bullish structure and the likelihood of further upside.
4. Upthrust at the Top: Is Bitcoin Entering a Distribution Phase?
At the top of the move, Bitcoin formed an Upthrust (UT) on ultra-high volume—the second largest volume spike since the rally began. This indicated potential smart money distribution, causing the price to retrace.
Bitcoin attempted to rally back into the UT zone, but the volume was significantly lower, suggesting weak demand. This is often a warning sign that the market is transitioning from accumulation to distribution.
5. Key Price Levels to Watch: Will Bitcoin Drop to $91,722?
If Bitcoin fails to break above the Upthrust bar with strong demand, we could see a price markdown toward $91,722—the area of highest volume support.
On the other hand, if Bitcoin continues higher, we need to see strength above the UT zone, characterized by:
✅ Wide price spreads on up-bars
✅ Increasing volume on rallies
✅ Low-volume retracements
Failure to meet these conditions could indicate that the Composite Operator is offloading positions, leading to further declines.
Leave a Reply