What is a Selling Climax Trading and How It Works
A selling climax trading event occurs when market participants panic, leading to a steep price drop on ultra-high volume. This selling pressure flushes out weak holders, setting the stage for professional investors to absorb supply quietly. Often, these professionals are the only ones willing to buy during extreme fear, which makes the setup so powerful. A wide-ranging down bar that closes off its lows—especially into fresh lows—signals potential absorption and bottoming. When followed by an up-bar, it confirms the presence of demand and the potential for trend reversal.
MOS Daily and Weekly Chart Breakdown
The appearance of a selling climax trading pattern on both the daily and weekly charts carries amplified significance. When a climax bar is visible across multiple timeframes, it signals a sentiment shift. This shift is not limited to short-term traders. Institutional players who operate on larger timeframes recognize this shift. This confluence increases the probability of a sustained trend reversal. A daily signal alone can offer tradeable opportunities.
However, a corresponding weekly confirmation provides context and broader market alignment. It also offers more reliable validation that the market is transitioning from a markdown phase into accumulation. Traders who understand this multi-timeframe alignment can enter with greater confidence. They hold positions with increased conviction because the setup is reinforced by a deeper market structure.
MOS Daily Analysis
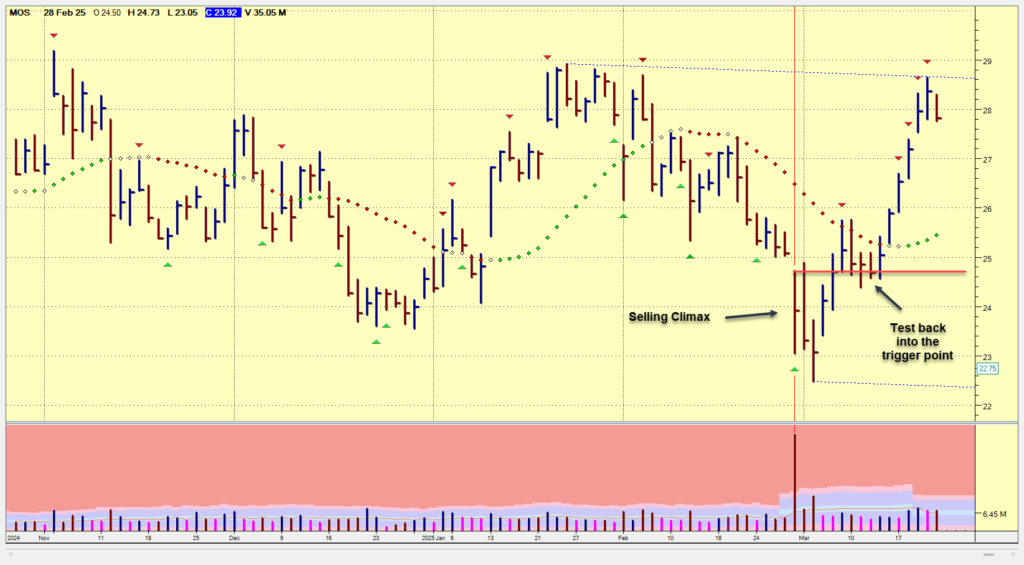
On February 28, 2025, MOS printed a textbook selling climax trading bar. The price dropped to $23.05 and closed at $23.92 on a massive 35.05 million shares traded, the highest daily volume in months. The chart reveals that the price dipped into new lows. It drew in panic sellers. Then it reversed sharply. Finally, it closed well above its intraday low. That strength into the close suggested that institutional buyers were absorbing the selling.

MOS Weekly Chart Analysis
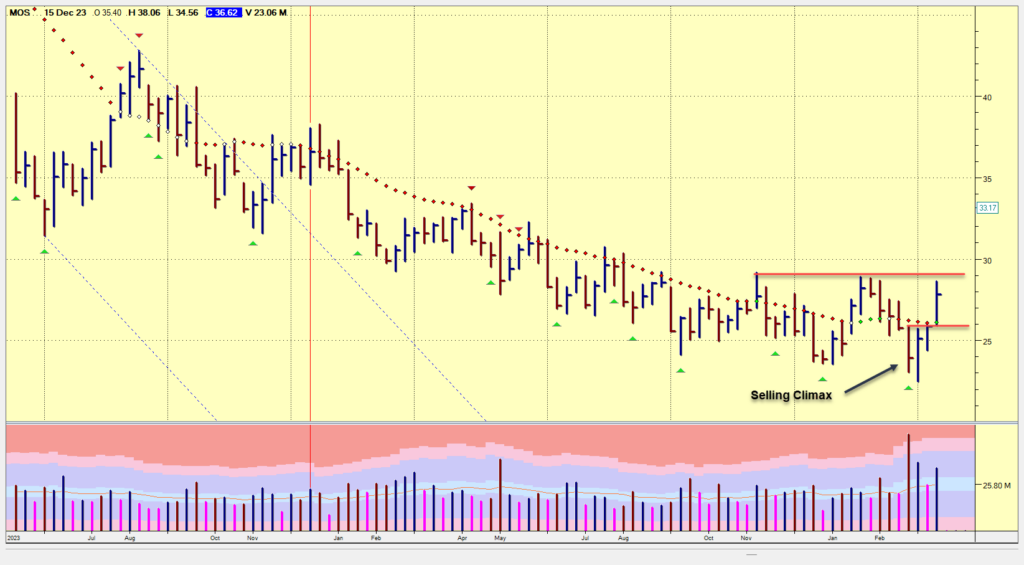
The weekly chart provides confirmation, with volume surging past 25.80 million shares (53.54 M). A strong weekly reversal bar emerged after months of consistent lower highs and lower lows. The breakout from this downtrend on expanding volume indicates a significant market shift from markdown to accumulation.
Follow-through action in the days that followed supports this conclusion. MOS formed higher highs and higher lows, suggesting strength behind the move. Volume began to decline on pullbacks, another hallmark of supply being absorbed. Traders using selling climax trading principles would spot this setup as a potential long entry with high reward potential.
The weekly chart provides confirmation, with volume surging past 25.80 million shares. A strong weekly reversal bar emerged after months of consistent lower highs and lower lows. The breakout from this downtrend on expanding volume indicates a significant market shift from markdown to accumulation.

Follow-through action in the days that followed supports this conclusion. MOS formed higher highs and higher lows, suggesting strength behind the move. Volume began to decline on pullbacks, another hallmark of supply being absorbed. Traders using selling climax trading principles would spot this setup as a potential long entry with high reward potential.
Selling Climax Trading: Executing the Strategy and Managing Psychology
Entering after a selling climax trading setup requires precision and discipline. The ideal time to go long is after a confirmation bar closes above the high of the climax bar. This move suggests that demand has taken control. Stops should be placed just below the low of the climax bar, offering a tight risk-to-reward window. Traders may also scale in, adding to positions as price continues to show strength and volume confirms.
Psychologically, this is where many traders struggle. During a selling climax, fear is widespread. News is bearish, sentiment is dire, and it feels like the worst possible time to buy. Yet, this is exactly how professionals act. To succeed, traders must learn to think like smart money—responding to structure and volume, not emotion. Those who have the patience to hold through accumulation often see major gains once the markup phase begins.
Final Thoughts
Selling climaxes are more than technical anomalies. They are deeply psychological events. These events create real opportunities for those trained to spot them. The key to selling climax trading is understanding the relationship between volume, price action, and human behaviour. With proper analysis and mental readiness, traders can turn panic into profit. Recognizing the signs of professional buying amid chaos can build a durable edge that outlasts short-term volatility.
Frequently Asked Questions (FAQs)
Q1: What confirms a valid selling climax trading setup?
A wide-ranging down bar on ultra-high volume, closing off the lows, followed by an up-bar is your primary confirmation.
Q2: When should I enter a selling climax trade?
After a confirmation bar closes above the high of the climax bar. That’s your signal that demand has taken over.
Q3: Can a selling climax setup fail?
Yes. If price breaks below the climax bar low, the setup is invalid. Always use a stop.
Q4: What timeframes work best?
Daily and weekly charts offer the clearest context and confirmation.
Q5: Is this suitable for beginners?
It can be—if you understand volume dynamics and manage risk appropriately.

Leave a Reply