The Wyckoff Method remains one of the most reliable frameworks for understanding market cycles, institutional activity, and price movements. By analyzing recent price action and volume dynamics, we can determine whether the market is positioning itself for accumulation (a bullish setup) or markdown (a bearish continuation).
Analyzing the S&P 500 with the Wyckoff Method
For this analysis, I am focusing on the S&P 500 index, one of the most widely followed benchmarks in the financial markets. The S&P 500 reflects overall market sentiment and institutional activity, making it a prime candidate for Wyckoff analysis. By observing price and volume dynamics, we can gain insight into whether the index is in a phase of accumulation, distribution, or potential breakout. Understanding this can help traders make informed decisions in their portfolios.
Understanding the Wyckoff Market Cycle
Wyckoff’s methodology is based on the idea that the market moves in distinct phases dictated by institutional activity. These include:
- Accumulation: Smart money absorbs supply before a new uptrend begins.
- Markup: The price moves upward as demand outweighs supply.
- Distribution: Institutions offload positions to retail traders, leading to weakness.
- Markdown: Price declines as supply overtakes demand, leading to further downside.
Let’s analyze recent price action through the lens of these Wyckoff phases.
Key Wyckoff Events in Recent Market Action
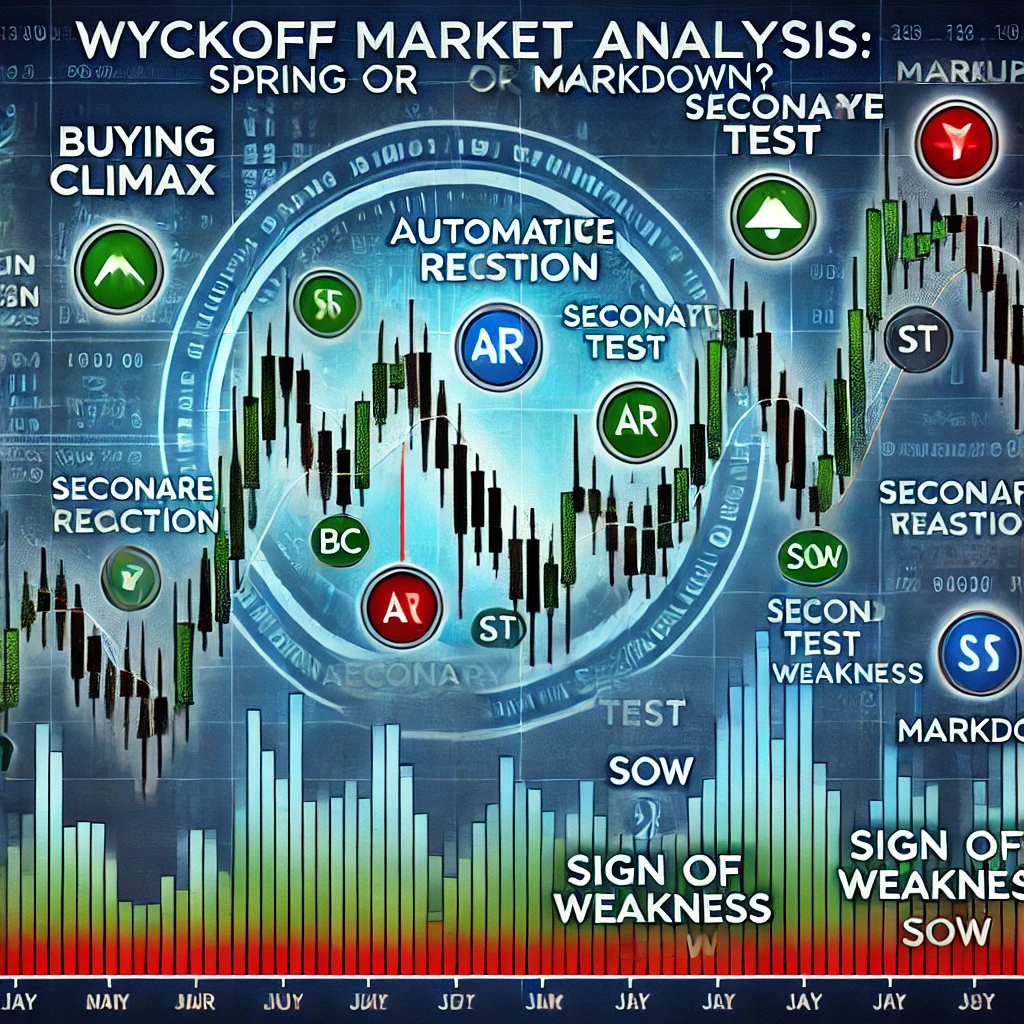
Buying Climax (BC) and Automatic Reaction (AR): Signs of Distribution?
In recent sessions, we observed a Buying Climax (BC) where the market surged to a new high on high volume, followed by an immediate pullback, known as the Automatic Reaction (AR). This is a sign that large players may be unloading positions rather than initiating new longs.
Secondary Test (ST) and Sign of Weakness (SOW): The Bulls Struggle
After the initial reaction, the market attempted a Secondary Test (ST), pushing back toward the previous high but failing to sustain its momentum. This was followed by a Sign of Weakness (SOW), where the price failed to recover and started making lower highs and lower lows. This suggests that the smart money may be shifting toward distribution rather than reaccumulation.
Spring or Further Markdown? The Decisive Moment
One of the most critical elements of Wyckoff analysis is identifying whether a market move is a Spring (bullish shakeout) or a true breakdown.
- A Spring occurs when the market briefly drops below support, triggering stop-losses and forcing weak hands out, only to reverse higher. This often precedes an accumulation phase.
- A true breakdown happens when price fails to reclaim prior support levels, leading to a full markdown phase.
Currently, the market is testing previous lows, which could indicate either a Spring or a deeper move into markdown territory.
Daily Wyckoff Commentary: Key Events and Institutional Activity
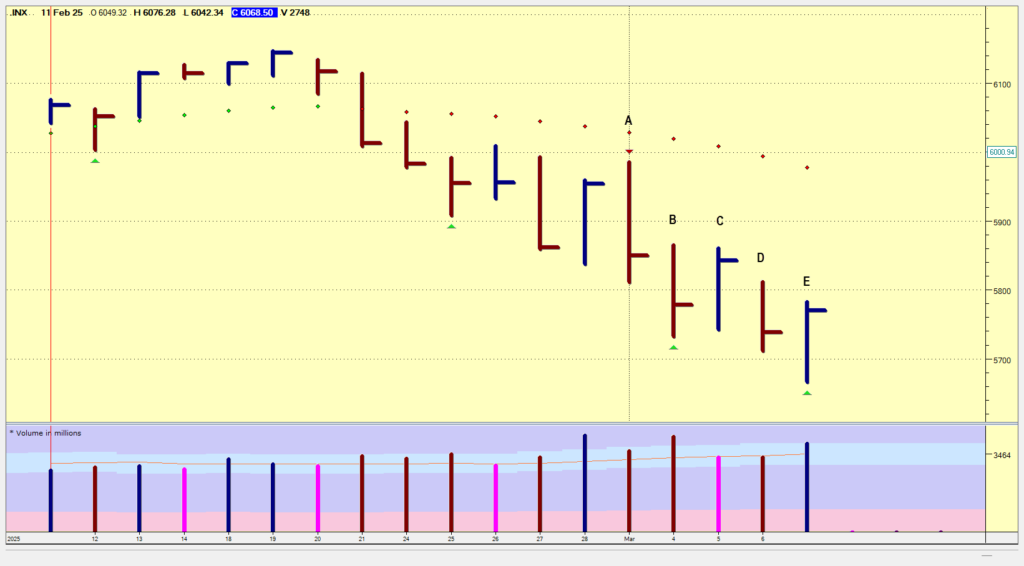
Point A: Buying Climax (BC) – March 3, 2025
- Market Action: Price opened at 5,968.33, reached a high of 5,986.09, and closed lower at 5,849.72.
- Volume: 5.61 billion, suggesting strong activity.
- Wyckoff Interpretation: This looks like a Buying Climax (BC), where institutions offload positions to retail traders. The high volume without significant price follow-through indicates potential distribution.
- Implication: A reaction (decline) is likely as the market absorbs the excess supply.
Point B: Automatic Reaction (AR) – March 4, 2025
- Market Action: Price made a sharp decline to a low of 5,732.59 before closing at 5,778.15.
- Volume: 6.13 billion, the highest in this sequence.
- Wyckoff Interpretation: This is the Automatic Reaction (AR)—a sharp drop after the Buying Climax. The high volume suggests supply dominance as weak hands exit positions.
- Implication: The market is likely entering a trading range or the start of markdown.
Point C: Secondary Test (ST) – March 5, 2025
- Market Action: The price rebounded, testing the previous highs at 5,860.59, but closed at 5,842.63, failing to sustain momentum.
- Volume: 5.28 billion, lower than the previous day.
- Wyckoff Interpretation: This represents a Secondary Test (ST), where buyers attempt to push prices back up, but volume is weaker, showing that demand is drying up.
- Implication: If a Sign of Weakness (SOW) follows, the distribution phase is confirmed.
Point D: Sign of Weakness (SOW) – March 6, 2025
- Market Action: Price made a lower high (5,812.08) and a lower close (5,738.52), showing a clear lack of demand.
- Volume: 5.16 billion, still declining.
- Wyckoff Interpretation: This is a Sign of Weakness (SOW), where the price fails to rally and starts drifting lower. The lack of strong volume on the upside confirms institutional selling pressure.
- Implication: The market is losing strength, and a potential breakdown or Spring is imminent.
Point E: Potential Spring or Breakdown – March 7, 2025
- Market Action: Price dipped to 5,666.29, the lowest level, before recovering to close at 5,770.20.
- Volume: 5.70 billion, slightly higher than the previous day.
- Wyckoff Interpretation: This could be a Spring, where price temporarily breaks below support to shake out weak hands before reversing.
- Implication:
- If price rallies above the AR level (5,778.15), it confirms a Spring and potential accumulation.
- If the price fails to rally and breaks below 5,666.29, it confirms further markdown.
How to Trade This Setup Using Wyckoff Principles
Bullish Scenario (Spring Confirmation)
- If the price reclaims lost support with strong volume, it confirms the presence of accumulation.
- Look for higher lows and increasing demand, suggesting that institutional buyers are stepping in.
- Enter long positions once price breaks above the automatic reaction (AR) level, signaling a new uptrend.
Bearish Scenario (Markdown Continuation)
- If the price fails to rally after dipping below previous lows, it suggests further distribution.
- A break below the Spring low on increasing volume confirms a markdown phase.
- Consider short positions on failed rallies, especially if volume remains high on down moves.
Final Thoughts: What’s Next for the Market?
Applying the Wyckoff methodology to price action provides valuable insights into institutional positioning and market direction. Whether this is a Spring leading to accumulation or a breakdown confirming markdown, traders should focus on volume dynamics, price structure, and key levels to anticipate the next move.
- Watch volume closely: Volume should confirm the direction of the breakout.
- Monitor price structure: A higher low after a Spring suggests a bullish reversal, while continued weakness signals further markdown.
- Be patient and wait for confirmation: Wyckoff trading is about understanding the story behind price action, not predicting every tick.
By mastering these concepts, traders can position themselves on the right side of the market and capitalize on high-probability trade setups.
Are you ready to use the Wyckoff Method in your trading? Share your thoughts, and let’s discuss them in the comments!
Further Reading:
Leave a Reply