
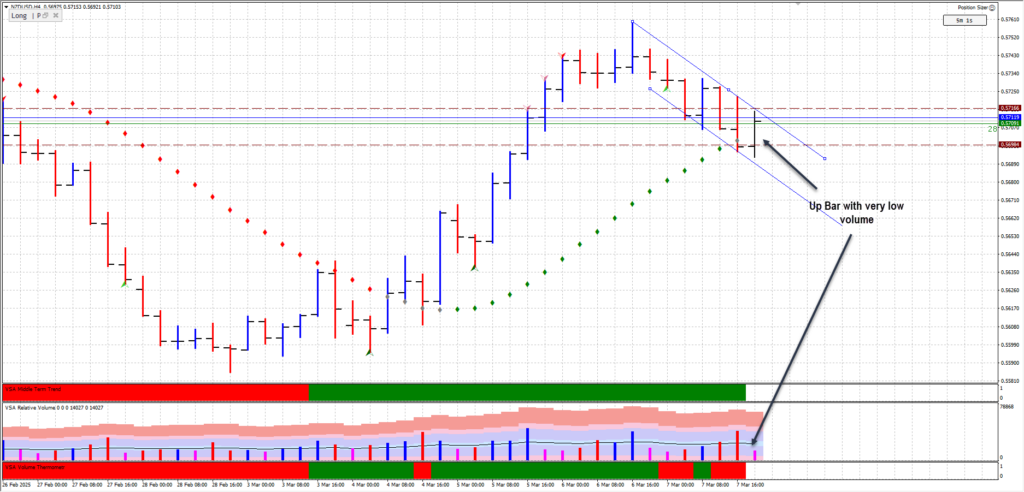
The NZD/USD currency pair has been showing weakness on the 1-hour chart, aligning with Wyckoff and Volume Spread Analysis (VSA) principles. A trap upmove during the recent non-farm payroll (NFP) release signaled potential weakness, followed by a no-demand bar, confirming the lack of buying interest. Meanwhile, the 4-hour chart reveals an upbar on very low volume, another classic sign of weakness.
This article will break down:
- The trap upmove and how it deceives retail traders.
- No demand & no supply bars as signals of institutional control.
- Ultra-high volume zones and trigger points to watch.
- How to apply Wyckoff and VSA concepts to plan a trade with minimal risk.
By the end, you’ll have a clear roadmap for interpreting volume and price action in NZD/USD and other forex pairs.
Understanding NZD/USD Weakness on the 1-Hour Chart
Trend Structure & Market Context
- The 1-hour chart shows a consistent downward trend channel, reinforcing NZD/USD weakness.
- During the NFP release, NZD/USD saw a rally to the supply line, only to drop sharply the next hour.
- Both the rally and decline occurred on ultra-high volume, suggesting that institutions were actively involved.
This setup provides an ideal scenario for applying Wyckoff and VSA principles to understand whether further weakness is ahead.
Trap Upmove & Ultra-High Volume Activity in NZD/USD
What is a Trap Upmove?
A trap upmove occurs when price briefly rallies, making it appear as if the market is turning bullish—only to collapse afterward. It’s a classic tactic used by smart money to lure retail traders into buying before unloading their own positions.
Key Observations in NZD/USD Weakness:
- During NFP, NZD/USD spiked higher, touching the supply line.
- The rally occurred on ultra-high volume, confirming institutional activity.
- Price quickly reversed lower, signaling that professionals were selling into the strength.
VSA Interpretation:
A trap upmove followed by a no-demand bar confirms that institutions have absorbed the liquidity and are no longer interested in higher prices.
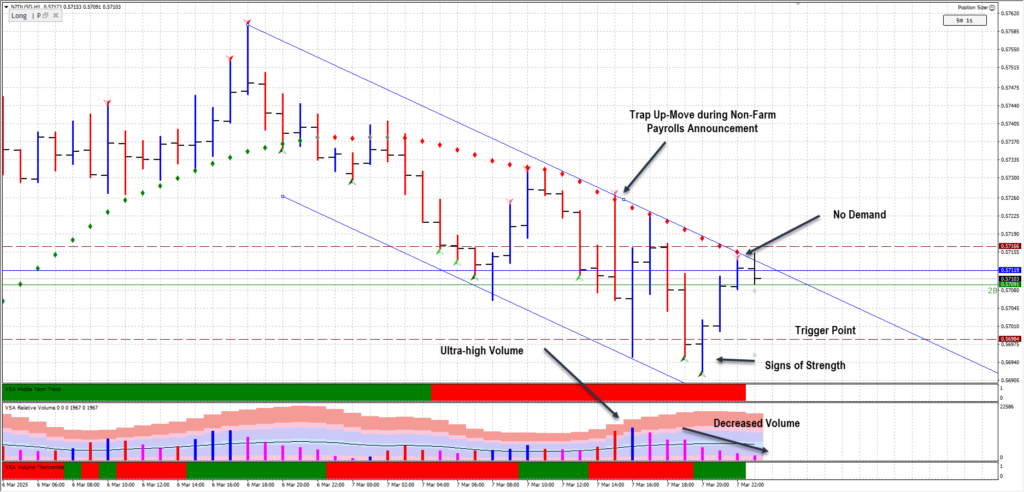
Volatility & Supply Line Retests
Price Behavior Post-Trap Upmove
After the initial rejection from the supply line, the price:
✅ Dropped back to the demand line, closing on its highs.
✅ Retested the supply line but failed to break above it.
✅ Displayed a No Supply Bar—a signal that selling pressure may be fading.
Key Wyckoff & VSA Signals at Play
No Supply Bar
📌 Definition: A bar with low volume indicates that sellers are drying up.
📌 NZD/USD Context: Appeared after the price tested the supply line, showing a temporary slowdown in selling pressure.
Test After Shakeout
📌 Definition: A temporary dip in price to test if selling pressure is exhausted.
📌 NZD/USD Context: Price dipped after the supply line test and rebounded, signaling a momentary balance in supply and demand.
No Demand Bar
📌 Definition: A small upbar with low volume, showing a lack of buying interest.
📌 NZD/USD Context: Appeared right after the trap upmove, confirming institutional disinterest in higher prices.
4-Hour Chart: Weakness Confirmed by No Demand Bar
The 4-hour chart provides additional confirmation of weakness.
- The last four hours of the trading session printed an upbar on very low volume.
- This is a textbook No Demand Bar, meaning smart money has no interest in pushing prices higher.
- Without buying interest, NZD/USD is likely to resume its downtrend.
🔎 VSA Insight: When an upbar forms on low volume, it means that price is rising due to a lack of selling, not because of strong buying—a significant difference that often precedes market drops.
Trigger Points & Risk-Managed Trade Execution
Key Trigger Points from March 5, 2024 (15:00 UTC):
📍 0.56984 – A critical level to monitor for price reactions.
Trade Execution Plan
✅ Wait for price action confirmation before entering.
✅ Risk only 0.25% of total account balance per trade.
✅ If the price moves in my favor, I’ll increase position size gradually.
Conclusion: Is NZD/USD Weakness Likely to Continue?
Based on Wyckoff & VSA analysis, NZD/USD is showing multiple weakness signals:
🔻 Trap upmove followed by no demand.
🔻 No supply bar confirming weak buyers.
🔻 No demand on the 4-hour chart.
🔻 Trigger points acting as potential support or resistance.
While the downtrend remains intact, it’s essential to watch for price action confirmation before committing to a short position.
🎯 Final Tip: If NZD/USD breaks below 0.56984 with low volume on upbars, this will further confirm weakness and provide an ideal short opportunity.
FAQs
1. What is a trap upmove in Wyckoff analysis?
A trap upmove is a rally that tricks retail traders into buying before reversing lower, indicating professional selling.
2. How does ultra-high volume confirm market direction?
Ultra-high volume can signal accumulation (buying) or distribution (selling). Context and price action must be analyzed together.
3. Why is there no demand after a trap upmove signal weakness?
A no-demand bar means buyers are not interested in higher prices. If it follows a trap upmove, it confirms that supply is dominant.
4. How can traders use trigger points to manage risk?
Trigger points act as key support/resistance levels based on high-volume bars. If price reacts with weak volume, it may indicate a continuation of the trend.
5. What role does VSA play in forex trading?
VSA helps traders interpret volume & price action to understand professional activity and market strength/weakness.
Further Reading
Leave a Reply